Getting Started
4 sections
Features
14 sections
Configuration
3 sections
Reference
3 sections
Iris Pro
1 sections
How it Works
From install to insights in four steps. Iris runs entirely locally — no backend, no AI, and no configuration required to get started.
Install & open a file
Install Iris from the VS Code Marketplace and open a supported file — the Iris sidebar populates instantly with no configuration required.

Read the File tab
Open any JS, TS, Go, or Python file — the File tab shows the health score, cyclomatic complexity, function list, import count, and detected code smells.

Run a workspace scan
Run Iris: Analyse Workspace from the command palette — the Problems tab and TODOs tab populate with aggregated findings across every file in the project.

Upgrade to Pro
Unlock advanced metrics with a Pro licence — regional pricing, sign in with Google or GitHub, and Pro features activate instantly after payment.

Overview
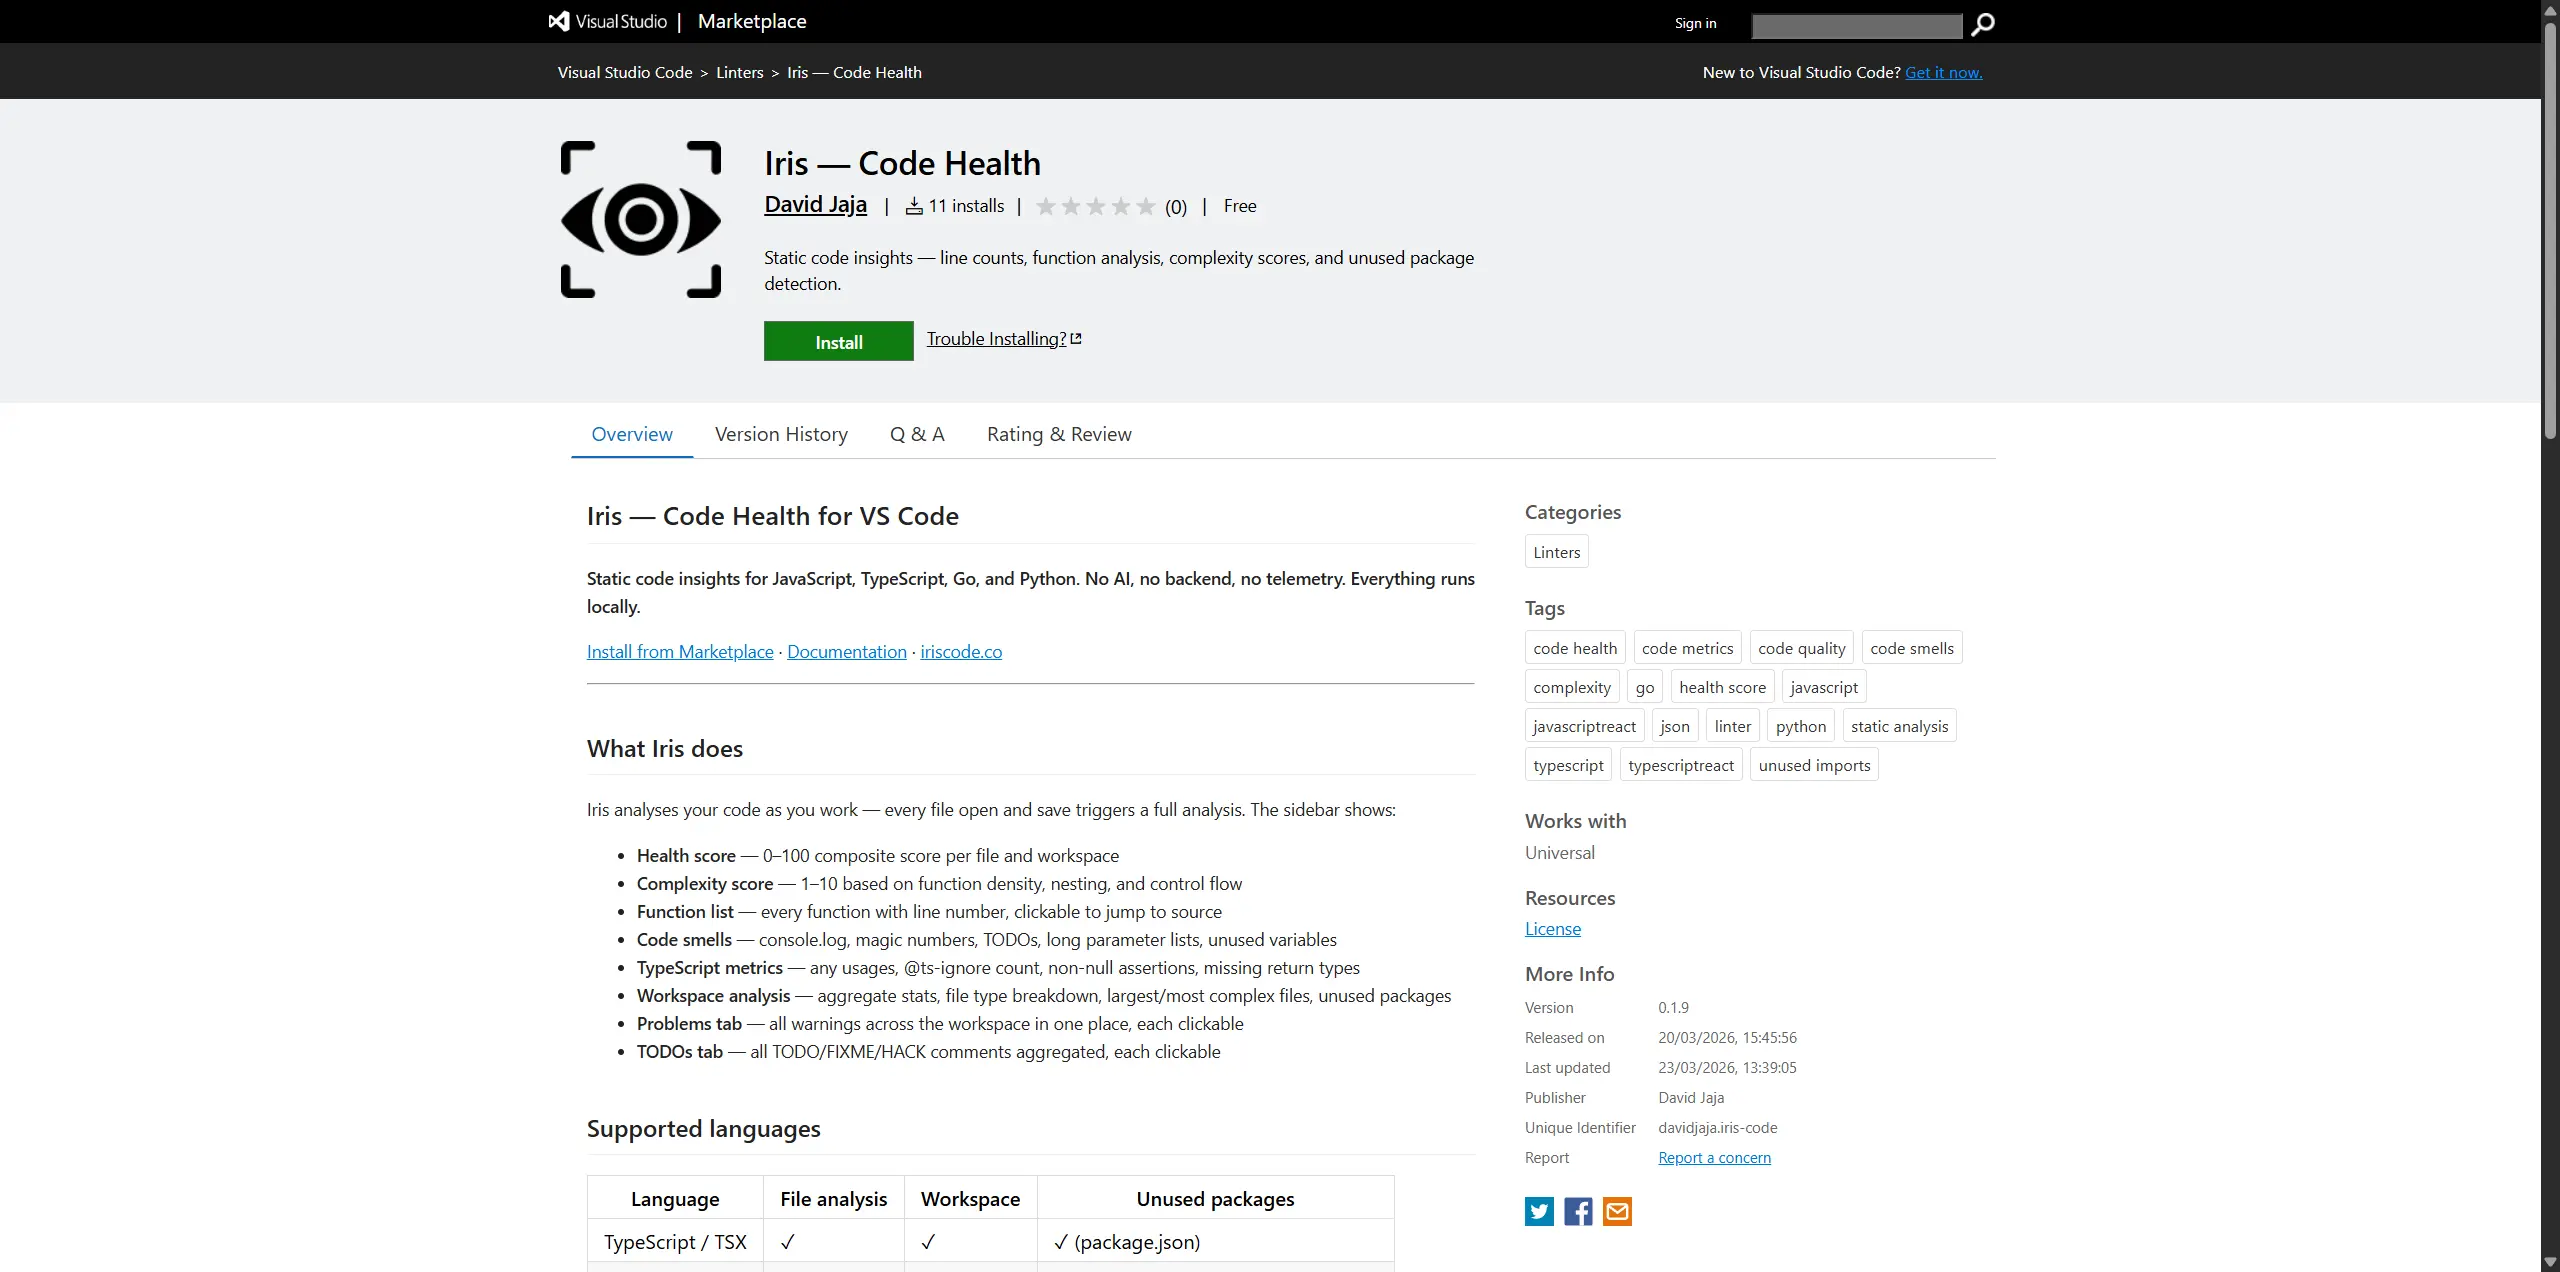
Iris is a VS Code extension for static code insights — health scores, complexity analysis, function detection, code smell detection, and TypeScript quality metrics. It supports JavaScript, TypeScript (JS/JSX/TS/TSX), Go, and Python. Everything runs locally — no backend, no AI, no telemetry.
- Automatic analysis on every file open and save
- Health score from 0 - 100 per file and workspace
- Complexity scoring, function lists, import tracking
- Code smell detection with clickable jump-to-line
- Workspace and folder-level aggregated stats
- Configurable thresholds via
.irisconfig.jsonor VS Code settings
Installation
Install Iris from the VS Code Marketplace — it's free.
- 1Open VS Code and go to the Extensions panel (
Ctrl+Shift+X) - 2Search for Iris and click Install
- 3The Iris icon appears in the Activity Bar
- 4Open any JS, TS, Go, or Python file — the sidebar populates instantly
Quick Start
Once installed, Iris works with zero configuration. Here's what to expect:
- Open any supported file — the File tab shows the health score, complexity, functions, and smells
- Run Iris: Analyse Workspace from the command palette to scan your entire project
- Right-click any folder in Explorer and choose Iris: Analyse This Folder for scoped analysis
- Click any warning or finding in the sidebar to jump directly to that line
- Add a
.irisconfig.jsonat your project root to share thresholds across your team
File Analysis
Iris analyses every supported file automatically as you open or save it. The File tab shows:
- Health score — 0–100 composite score penalising warnings, deep nesting, long functions, and debug prints
- Trend delta — ↑/↓ change vs the previous snapshot, shown next to the health score after the first workspace scan
- Language badge — Go / TypeScript / JavaScript / Python badge in the file header
- Line counts — total lines, blank lines, code lines
- Complexity score — 1–10 score based on function density, nesting depth, control flow, and import count
- Function list — all detected functions with line numbers, each clickable to jump to source
- Import tags — third-party packages detected via import statements
- Unused imports — named/default/namespace bindings that are imported but never referenced (TypeScript/JavaScript only)
- Test file indicator — flags whether a corresponding test file exists (configurable via
testConventionin.irisconfig.json)
TypeScript Metrics
Shown only for TS/JS files; hidden automatically for Go and Python.
| Metric | What it tracks |
|---|---|
any usages | Counts explicit : any / as any. Each occurrence is clickable. |
@ts-ignore | Count of TypeScript suppressions |
| Non-null assertions | Count of ! usages |
| Missing return types | Exported functions without an explicit return type annotation |
Python Support
Full Python analysis with language-aware routing:
- Functions — all
defdeclarations detected (top-level and class methods), with line numbers - Third-party imports —
import pkgandfrom pkg import ...; stdlib modules are excluded automatically - print() calls — flagged in Code Lens and Code Smells
- No public functions warning — flags if all functions start with
_(private by convention) - Unused Python packages — workspace scan reads
requirements.txtandpyproject.tomland flags declared packages never imported across.pyfiles __pycache__,.venv,venv— skipped automatically during scans- Parameter lists —
selfandclsare excluded from the parameter count
Go Support
Full Go analysis with language-aware routing:
- Functions — both top-level
func Name(and methodsfunc (r *T) Name(detected - Third-party imports — packages with a dot in the root path segment (e.g.
golang.org/x/...,pkg.example.com/...) - Debug prints —
fmt.Print*,log.Print*,log.Fatal*,log.Panic*flagged in Code Lens and Code Smells - No-exports warning — flags if no capitalised (exported) function names are found
- Unused Go modules — workspace scan reads
go.modand flags declared modules never imported across.gofiles vendor/directory — skipped automatically during workspace/folder scans
Code Smells
Iris detects several code smell patterns across all supported languages. Every finding is clickable to jump to the line.
| Smell | Detected in | Toggle setting |
|---|---|---|
Debug prints — console.log/warn/error | JavaScript / TypeScript | enableConsoleLogWarnings |
Debug prints — fmt.Print* / log.Print* / log.Fatal* / log.Panic* | Go | enableConsoleLogWarnings |
Debug prints — print() | Python | enableConsoleLogWarnings |
| Magic numbers — raw numeric literals (excluding 0 and 1) used inline without a named binding | All supported languages | enableMagicNumberDetection |
TODOs / FIXMEs / HACKs — from // comments (JS/TS, Go) and # comments (Python) | All supported languages | enableTodoDetection |
| Long parameter lists — functions with too many parameters | All supported languages | enableLongParamDetection |
| Unused variables — declared but never referenced elsewhere in the file | All supported languages | enableUnusedDetection |
| Unused functions — defined but never called within the file and not exported | All supported languages | enableUnusedDetection |
Warnings
Five warning types, each with configurable severity:
| Type | Default severity | Triggers at |
|---|---|---|
file-too-long | error / warning | > threshold / > ⅔ threshold |
function-too-long | error / warning | > 2× threshold / > threshold |
too-many-functions | warning | > maxFunctionsPerFile |
too-many-imports | warning | > maxImportsPerFile |
no-exports | info | no exported identifier found |
severityOverrides in .irisconfig.json.Workspace Analysis
Run Iris: Analyse Workspace from the command palette or the Scan Workspace button in the Workspace tab to get:
- Total files, directories, lines, functions
- File type breakdown with an interactive pie chart
- Largest files (top 5) and most complex files (top 5)
- Unused packages declared in
package.json,go.mod,requirements.txt, orpyproject.tomlbut never imported - All warnings aggregated into a Problems tab with error count badge
- All TODOs aggregated into a TODOs tab, grouped by type
- Interactive file tree grouped by directory
- Trend summary — overall health score delta since the last snapshot, top 3 improved files, and top 3 regressed files
- Results are cached — navigate away and come back without re-scanning
Folder Analysis
Right-click any folder in Explorer and choose Iris: Analyse This Folder, or click Scan Current Folder in the Folder tab to analyse the folder of the currently open file.
Results appear in the dedicated Folder tab, which auto-activates on scan. The Folder tab shows the same stats, pie chart, ranked files, and tree as the Workspace tab, plus Rescan and Clear buttons.
Problems & TODOs
The Issues and TODOs tabs populate from the most recent folder or workspace scan. Each row shows severity (colour-coded dot), filename, line number, and message — all clickable to jump to source.
- Issues tab badge shows the error count (red) or total issue count
- TODOs tab badge shows the total count of TODO/FIXME/HACK items found
- Findings persist until you run a new scan or click Clear
Code Lens
Inline hints appear above functions that exceed the length threshold. Language-aware:
- JS/TS: hints next to every
@ts-ignoreandconsole.log - Go: hints next to
fmt.*/log.*debug print calls - Python: hints next to
print()calls
Disable Code Lens via VS Code setting: iris.enableCodeLens: false
Status Bar
Shows health score, line count, and function count for the active file. Turns warning/error colour based on health score and complexity threshold. Works for all supported languages.
Disable via VS Code setting: iris.enableStatusBar: false
Detached Panel
Pop Iris out of the narrow sidebar and into a full editor column beside your code. The panel shows the same analysis as the sidebar but with more space for the two-column layout.
How to open
Click the pop-out icon in the Iris sidebar title bar, or run Iris: Open in Panel from the command palette (Ctrl+Shift+P). Close it the same way to restore the sidebar.
What the panel does
- Auto-refreshes when you switch files or save — always showing the current file
- Switches to a two-column layout when wide enough (≥700px): file stats on the left, findings on the right; workspace ranked lists go side-by-side
- While the panel is open, the Iris sidebar shows a placeholder so data is never duplicated
- Supports jump-to-line — click any finding or function to jump to that exact line in the editor
Trend Tracking
Iris saves a daily health-score snapshot for each file after a workspace scan. Over time these snapshots show whether your codebase is improving or regressing.
Where trends appear
- File analysis — a ↑/↓ delta is shown next to the health score, comparing the current score against the previous snapshot
- Workspace analysis — after each scan you see the overall score delta, a list of top 3 improved files, and a list of top 3 regressed files
How snapshots work
- One snapshot is saved per day — running multiple scans on the same day updates the existing snapshot rather than creating a new one
- Snapshots are stored in
.iris-snapshots/at your workspace root .iris-snapshots/is automatically added to your.gitignore— snapshots are local to each developer- To reset your history, delete the
.iris-snapshots/folder
iriscode.co/pricing.Export Report
Save your current analysis as a standalone dark-themed HTML file you can share with your team, attach to a PR, or keep as an archive.
How to export
- 1.Run any analysis — file, workspace, or folder
- 2.Open the command palette and run
Iris: Export Scan Report as HTML - 3.Choose a save location — defaults to
iris-report.htmlin your workspace root - 4.Click Open in Browser in the prompt to preview the report immediately
What's included
- File analysis — health score, warnings table, and functions table for the currently analysed file
- Workspace analysis — summary stats grid, top files by health score, and file type breakdown
- Folder analysis — scoped results for the selected folder
- Only sections you have actually run are included in the report
The default filename is iris-report.html. The file is self-contained — no external assets or internet connection needed to open it.
VS Code Settings
Open settings with Ctrl+, and search "Iris" to configure:
| Setting | Default | Description |
|---|---|---|
iris.functionLengthThreshold | 40 | Lines before a function is flagged |
iris.fileLengthThreshold | 300 | Lines before a file is flagged |
iris.maxFunctionsPerFile | 10 | Max functions before flagging |
iris.maxImportsPerFile | 8 | Max third-party imports before flagging |
iris.maxParameterCount | 5 | Max parameters before flagging a function |
iris.complexityThreshold | 7 | Complexity score that triggers status bar warning |
iris.enableConsoleLogWarnings | true | Flag console.log / print() / fmt.Print* statements |
iris.enableMagicNumberDetection | true | Flag raw numeric literals used without a named binding |
iris.enableTodoDetection | true | Flag TODO / FIXME / HACK comments |
iris.enableLongParamDetection | true | Flag functions with too many parameters |
iris.enableUnusedDetection | true | Flag unused variables and functions |
iris.enableMissingReturnTypeWarnings | true | Flag exported functions missing return types (TS/JS only) |
iris.enableCodeLens | true | Show inline Code Lens hints |
iris.enableStatusBar | true | Show Iris item in status bar |
iris.severityOverrides | {} | Override severity per warning type |
iris.ignoreFiles | ["**/*.test.ts", ...] | Glob patterns for files to skip in workspace analysis |
iris.ignoreFunctions | [] | Function names Iris should never flag |
.irisconfig.json
Drop a .irisconfig.json at your project root and commit it. Every developer on the team runs Iris with the same thresholds — no per-machine drift.
Priority order: .irisconfig.json → VS Code settings → defaults
{
"functionLengthThreshold": 40,
"fileLengthThreshold": 300,
"maxFunctionsPerFile": 10,
"maxImportsPerFile": 8,
"maxParameterCount": 5,
"complexityThreshold": 7,
"enableConsoleLogWarnings": true,
"enableMagicNumberDetection": true,
"enableTodoDetection": true,
"enableLongParamDetection": true,
"enableUnusedDetection": true,
"enableMissingReturnTypeWarnings": true,
"enableCodeLens": true,
"enableStatusBar": true,
"ignoreFiles": [
"**/*.test.ts",
"**/*.spec.ts",
"**/generated/**"
],
"ignoreFunctions": [
"main",
"handler"
],
"testConvention": "colocated",
"sidebarFontSize": 14,
"severityOverrides": {
"file-too-long": "warning",
"function-too-long": "warning",
"too-many-functions": "warning",
"too-many-imports": "warning",
"no-exports": "warning"
}
}Only include the keys you want to override — anything omitted falls back to VS Code settings, then defaults.
testConvention — controls where Iris looks for test files alongside the analysed file. "colocated" (default) checks for foo.test.ts / foo.spec.ts next to the source file. "dedicated" looks in __tests__/foo.test.ts. "both" checks all locations.
sidebarFontSize — base font size in pixels (10–20, default 14) for the Iris sidebar and detached panel.
Severity Overrides
Override the severity of any warning type on a per-project basis:
| Warning key | Valid severities |
|---|---|
file-too-long | error · warning · info |
function-too-long | error · warning · info |
too-many-functions | error · warning · info |
too-many-imports | error · warning · info |
no-exports | error · warning · info |
Commands
All commands are available via the command palette (Ctrl+Shift+P):
| Command | Description |
|---|---|
Iris: Analyse Current File | Manually re-analyse the active file |
Iris: Analyse Workspace | Analyse all JS/TS/Go/Python files in the workspace |
Iris: Analyse This File | Right-click a file in Explorer to analyse it |
Iris: Analyse This Folder | Right-click a folder in Explorer to analyse it |
Iris: Analyse Current Folder | Analyse the folder of the currently open file |
Iris: Open in Panel | Pop the sidebar out into a full editor panel beside your code |
Iris: Export Scan Report as HTML | Save the current analysis as a standalone HTML report |
Iris: Show Welcome Page | Open the Getting Started welcome page |
Context Menus
Iris adds entries to the right-click menu in two places:
Explorer (file tree)
- Right-click a JS/TS/Go/Python file → Iris: Analyse This File
- Right-click a folder → Iris: Analyse This Folder
- Right-click anywhere → Iris: Analyse Workspace
Editor (inside a file)
- Iris: Analyse Current File
- Iris: Analyse Current Folder
- Iris: Analyse Workspace
Scoring & Metrics
Health score
Per-file composite score from 0 to 100. Starts at 100 — deductions are applied based on findings. Floor is 0, never negative. Fully deterministic: same code always produces the same score.
| Finding | Deduction |
|---|---|
| Error-level warning | −5 each |
| Warning-level warning | −3 each |
any usage | −2 each |
@ts-ignore | −3 each |
console.log | −1 each |
| Deep nesting (per function) | −2 each |
| Long parameter list (per function) | −1 each |
| Unused variable | −1 each |
| Unused function | −2 each |
@ts-ignore carries a heavier penalty than console.log because it is an active decision to suppress the type system. Unused functions carry a heavier penalty than unused variables because a dead function is a maintenance trap — someone will eventually spend time tracing it and find it does nothing.Complexity score
Separate 1–10 scale that answers a different question from health: not “is this code problematic?” but “how hard is this code to reason about?” Score starts at 1 and caps at 10. Each factor has a cap on its contribution — no single factor can max out the score alone.
| Factor | What it measures |
|---|---|
| Function density | Number of functions relative to file size. Reflects how much is packed into one place. |
| Max indentation depth | Proxy for nesting complexity. Deeply indented code usually means deeply nested logic. |
| Control flow count | Every if, for, while, switch, catch, and ternary is a decision point that multiplies paths through the code. |
| Third-party import volume | A file pulling in many external dependencies tends to be doing many things. |
Workspace health score
Average of all per-file health scores across the scanned project. One very unhealthy file will pull the average down but won't dominate the score unfairly.
Language differences
any usage, @ts-ignore, non-null assertions, missing return types — only apply to JS/TS files and are automatically zeroed out for Go and Python. Health scores are not directly comparable across languages: a Go file and a TypeScript file with identical structure may score differently.Configurable thresholds
The thresholds that feed into the health score — function length, file length, max functions per file, max imports per file, max parameter count — are all configurable via VS Code settings or .irisconfig.json. Two projects can produce different health scores for the same file if their thresholds differ.
Iris Pro
Iris is free to install and use for file analysis. Pro unlocks workspace and folder-level features.
What's included in Pro
- Workspace analysis — scan your entire project at once
- Folder analysis — scoped scans for any directory
- Problems tab — all warnings aggregated with error count badge
- TODOs tab — all TODO/FIXME/HACK items aggregated across your project
- Clickable jump-to-line on all findings
.irisconfig.jsonteam config support- Unlimited trend history — track health score changes week over week, month over month
How to upgrade
Go to iriscode.co/pricing and click Get Pro. Pricing is adjusted for your region automatically.
How sign-in works
- 1.Run Iris: Sign In from the VS Code command palette
- 2.Your browser opens and you sign in with Google or GitHub
- 3.You're redirected back to VS Code automatically — no copy-pasting needed
- 4.Pro features unlock instantly
Managing your subscription
Visit iriscode.co/account/billing to:
- View your current plan and renewal date
- Cancel or reactivate your subscription
- Update your payment method if a card expires
If you cancel, you keep Pro access until the end of your current billing period.
What happens if payment fails
Paystack retries automatically over a few days. Your Pro access stays active during retries. If all retries fail, your subscription is cancelled and you revert to the free plan. You'll receive an email if this happens.